I worked at PDI during Shrek, but have been working at NVIDIA since 2002.
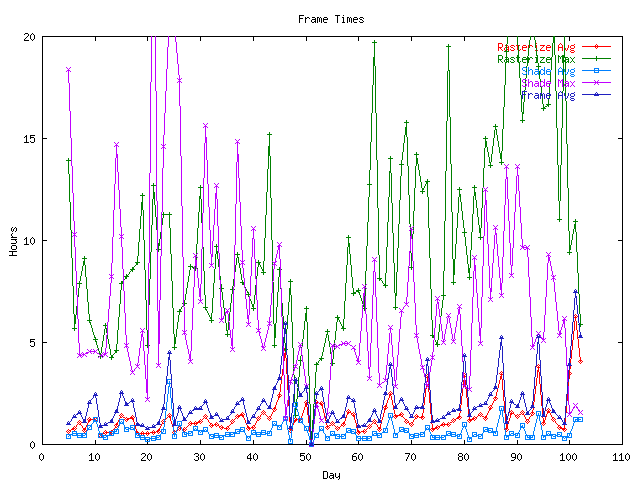
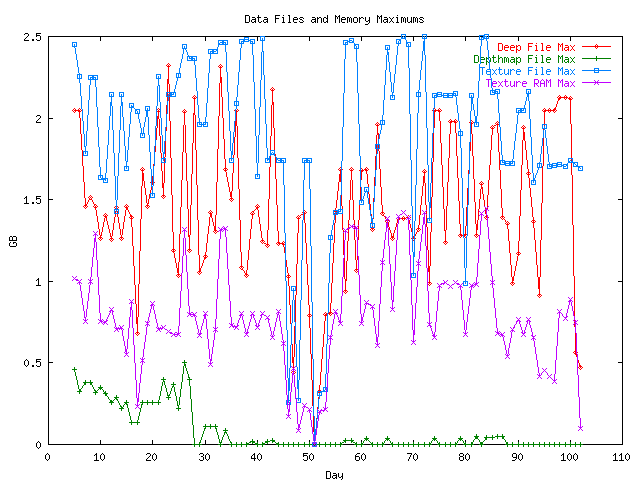
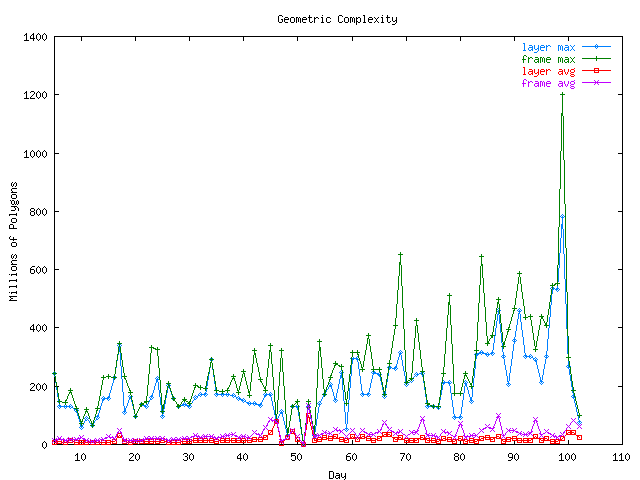
Each time we render a frame a text log file is generated with statistics, debugging and error information. Currently, we generate statistic information only for the beauty passes and not during depth map generation or quick shaded motion renders. The graphs below come from a program I wrote that parses the log files for the statistics data, munges the data and appends the overall averages and maximums to a separate file which is then graphed using gnuplot.
Data gathering started on November 8th, 2000, so the X-axis is “days since 11/8/00″.
The maximum values are the largest single daily value. The averages are the average of all the frames for each day. The “Frame Avg” value is the sum of the rasterization and shading averages.
Each frame is made up of several layers. Each night, only a few of the layers for a given frame are rendered. The other layers have either already been rendered, or are skipped. So, these times do not, in general, reflect the real time it would take to render a frame. Gathering that data would be very difficult.
At PDI, we separate rendering into two stages, rasterization and shading. Rasterization handles all the geometry and determines what is visible from a given camera and stores the information in a “deep file” which is passed to the shading program. The shading program loads all the textures, depth maps, and then streams through the deep file calling all the material, map, light and pixel shaders to determine the surface colors and finally filters and stores the result into a standard image file.
The Deep file is rasterized in tiles, so it isn’t all in memory at the same time. The “Texture Files” line represents the file size of all textures used to shade the scene. Since we only load the levels in the MIP-map that we actually need, we use much less memory when texture maps are in the distance or out of view. The “Texture RAM” line shows that we generally load about 1/3 of the files into memory during shading. This would be even lower if we didn’t use “Scan Conversion” so often, which forces loading of the largest MIP-map level. Scan conversion doesn’t do MIP-map filtering, but instead scan converts the actual texture polygon in the texture map for a higher quality filtering.
The maximum values represent the largest value from a single log file for that day.
We gather statistics for each layer rendered, and totals for all layers in a frame. This graph shows the average and maximum polygons rendered for each day. It seems as if we generally have one big layer in each shot. This is probably represents the fact that we don’t render all of the layers for a frame each night.
This graph is included just for fun. This represents the number of polygons rendered for a given layer (not frame) divided by the number of pixels in the image (1828*990 =~ 1.8M pixels/image), better known as Polygons/Pixel or sometimes, absurd complexity.


